Single Band-to-Band Registration (Rotation and Translation)
Source:R/registerBand3.R
registerBand3.RdHyperspectral image acquisition normaly causes spatial misalignment between the spectral bands (layers) due to both equipment (such as band-to-band recording delay) and external factors (e.g. sensor vibrations). In this case, a geometric correction is necessary for remote sensing applications such as combining/merging spectral bands. This function uses the HOG (Histogram of Oriented Gradient) descriptor in order to find the optimal rotation angle and translation (xy shift) on a 'slave' band to be spatially align with a 'master' (reference) band.
registerBand3(slave, master, ncells = 24, orient = 8, start_affine)
Arguments
| slave | An object of class |
|---|---|
| master | An object of class |
| ncells | An integer giving the number of cells to compute the oriented
gradients of the HOG descriptor. Default is 24. See |
| orient | An integer giving the number of orientations to compute the
oriented gradients of the HOG descriptor. Default is 8. See |
| start_affine | A numeric vector containing the starting values for the
affine parameters to be optimized, i.e., the shift in x and y and the
rotation angle (in degrees). Example: |
Value
An object of the same classe as the input slave, with
the fixed extent. An additional attribute called 'affine_pars' is
stored, containing the rotation angle (degrees) and the shift in x and y
in the same unit as the spatial extent of the image.
Details
This should be used carefully, as rotation affects the spatial
dimensions. It is recommended to try registerBand() first.
The affine parameters are estimated using a general optimization algorithm.
See also
Examples
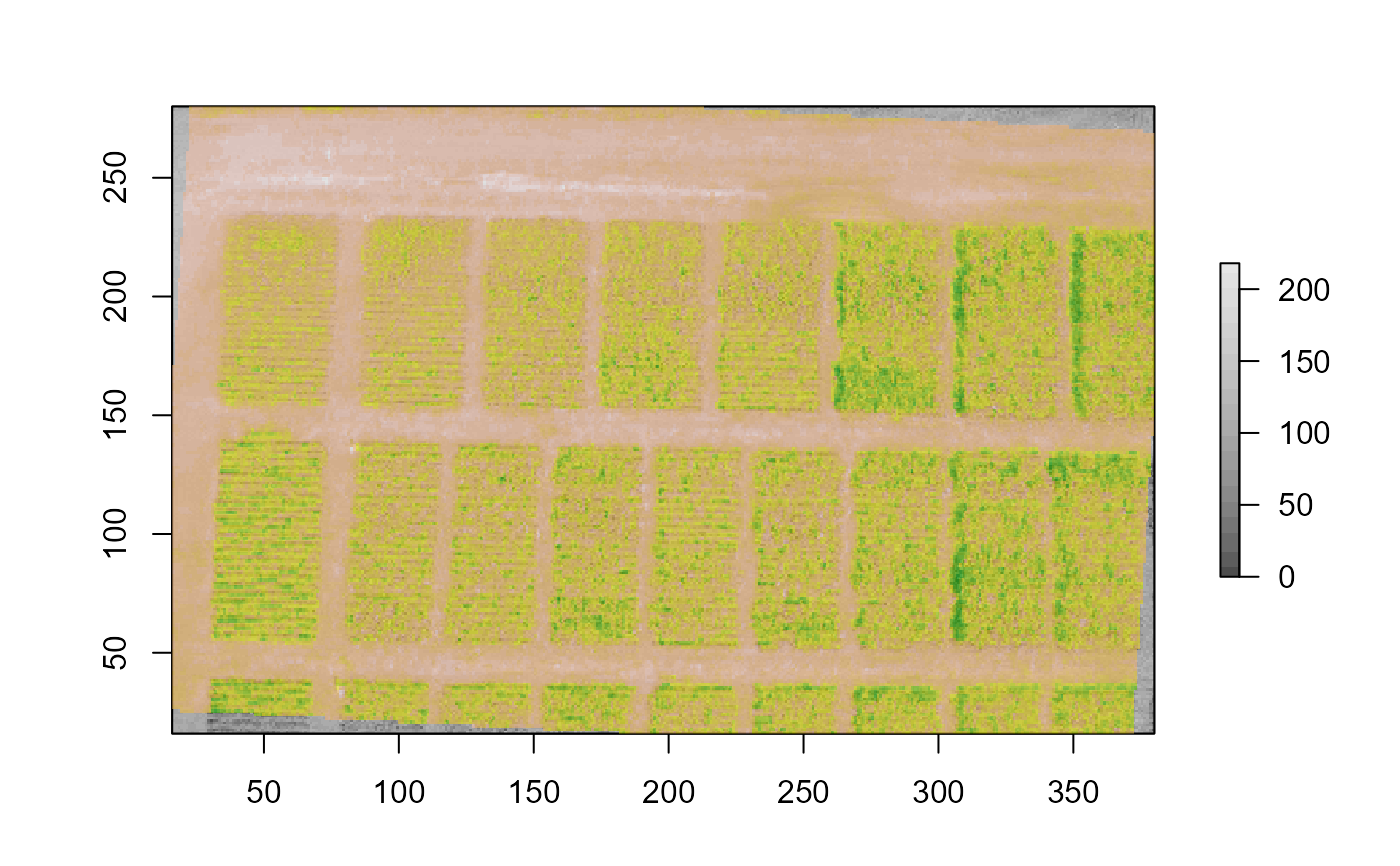
p <- system.file('exdata', 'soybean.tif', package = 'hyperbrick') im <- brick(p) print(im) #> class : RasterBrick #> dimensions : 264, 364, 96096, 3 (nrow, ncol, ncell, nlayers) #> resolution : 1, 1 (x, y) #> extent : 16, 380, 16, 280 (xmin, xmax, ymin, ymax) #> crs : NA #> source : soybean.tif #> names : soybean.1, soybean.2, soybean.3 #> min values : 45.41772, 12.00000, 0.00000 #> max values : 236.4372, 239.0000, 218.0000 #> # see how layer 1 is misregistered plot(im[[3]], col = gray.colors(20), asp = 0) plot(im[[1]], add = TRUE, legend = FALSE, col = adjustcolor(terrain.colors(20), 0.6))b1_reg <- registerBand3(slave = im[[1]], master = im[[3]], start_affine = c(0, 0, -2.5)) attr(b1_reg, "affine_pars") #> sx sy angle #> 0.6370885 0.2898663 -3.3294753 plot(im[[3]], col = gray.colors(20), asp = 0) plot(b1_reg, add = TRUE, legend = FALSE, col = adjustcolor(terrain.colors(20), 0.6))